How I use PicoMeasure
I wrote PicoMeasure to make it easy for me to create measurement data that I could readily export to Excel**, GnuPlot or similar programs.**Excel is no good at logarithmic plots...
I primarily use it for creating bode plots. (yes I know the Picoscope software can do this).
I do a 3rd octave sweep using 31 separate accurately recorded wav files of 10 seconds in length, which I got from the Bink Audio Test CD.
Note: I have since generated my own set of test frequencies, and I also have a signal generator for testing beyond the capability of computer audio
hardware (which was the whole point of PicoMeasure in the first place)
The frequencies are:
16,20,25,31.5,40,50,63,80,100,125,160,200,250,315,400,500,630,800,1000,1250,1600,2000,2500,3150,4000,5000,6300,8000,10000,12500,
16000,20000
I play these back using FooBar2000, and then capture at timed intervals.
I am currently using a Tapco Link.FireWire 4x6 Audio Interface along with AudioTester for measurements made via my PC.
I use my PicoScope and PicoMeasure when the Tapco hardware is unable to measure high enough frequencies.
All output from PicoMeasure is automatically converted to units - e.g. kHz to Hz, mV to Volts etc.
I have also written an application to graph the output from PicoMeasure - GraphTool can be downloaded here.
You can also use the graph tool of your choice to process the output from PicoMeasure - this is my GnuPlot script.
This script accepts two parameters, the input filename, and the name you want to assign to the graph.
You can also download my Windows WGnuplot script here
It's a plain text file (zipped) and can be edited with NotePad++
You can see the last plot command I used below, and you just need to change your input file details accordingly.
plot 'C:\scope-temp\0_test\tda1541mk2.txt' u 1:2 w l ls 1 t "tda1541"
Note: If you are viewing this on a mobile device you may not see the Gnuplot script below:
This results in a plot like this:
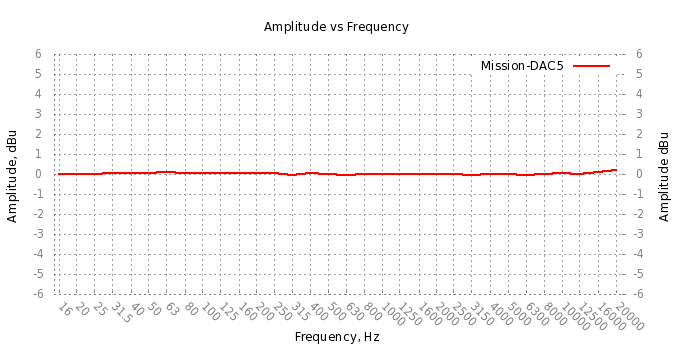
So this gives me a 'poor mans' bode plot!
I have verified the output using an audio milllivoltmeter and a manual plot (time comsuming!).
This is the script I wrote to normalise and filter the output to two columns, frequency and dBu.
This script parses all .txt files in the given directory, and then outputs a single file, the name of which you give on the command line.
Note: If you are viewing this on a mobile device you may not see the bash script below:
Credit for the awk script below goes to Stack Overflow contributors.
Note: from what I can tell, when measuring a spread of different frequencies, it is necessary
to adjust the timebase to maintain at least 3 full cycles of the waveform during the measurement process, to maintain measurement accuracy.
My Owon SDS5032E suffers the same issue - as less of the full waveform displayed, so the RMS voltage decreases.
I am also working on getting similar data out of my Owon SDS5032E using a script - this is a better solution, as the Owon
has an automatic timebase facility, while the PicoScope (the 2204A at least) does not.
Hopefully I can then use PicoMeasure with my Owon (and change the name to OwonMeasure??) :-)
Links:
Gnuplot for WindowsMore to come.../